
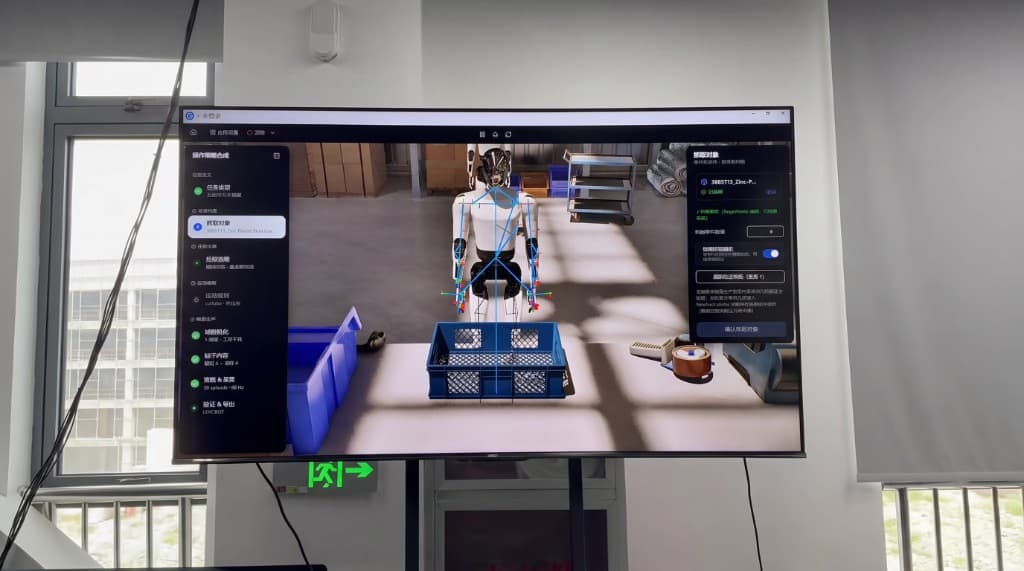















Modular entry
Start from one vertical problem — virtual commissioning / training sim / remote O&M / risk drills — prove value fast.
Deep scenario insight for industrial visualization — make value visible
Industry Truth
We believe the end goal of visualization is creating business value. Whether shortening surgical planning cycles, raising industrial design efficiency, or lowering the barrier to expert decisions — every pixel serves measurable outcomes.
BENCHMARKING CASE
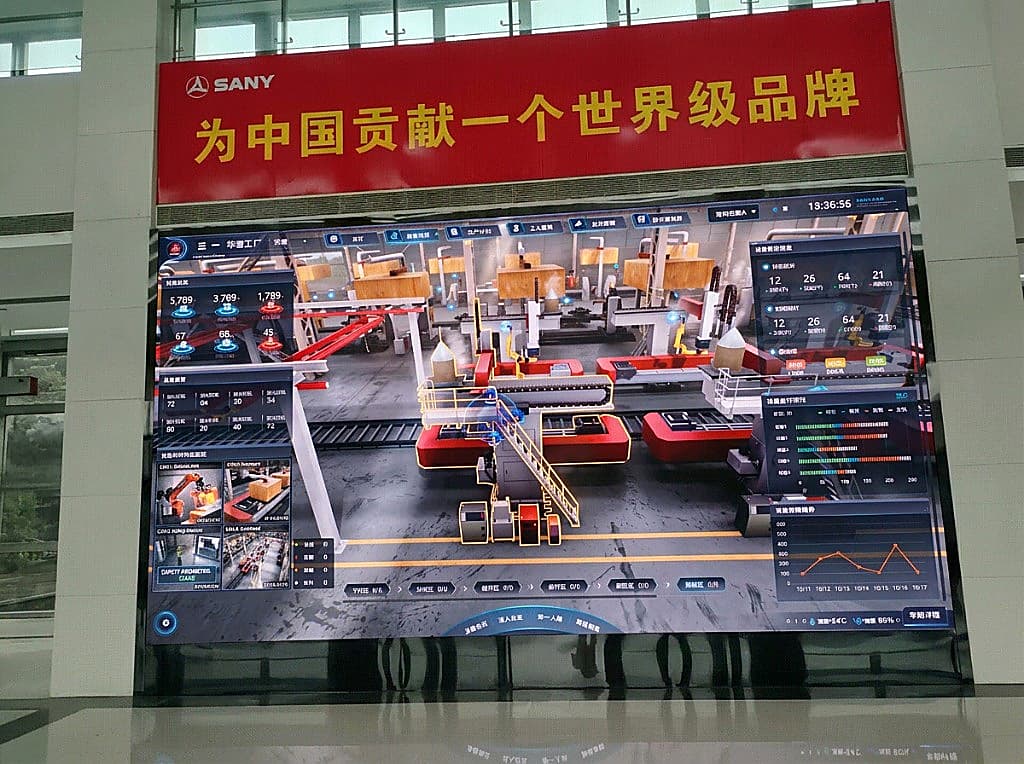
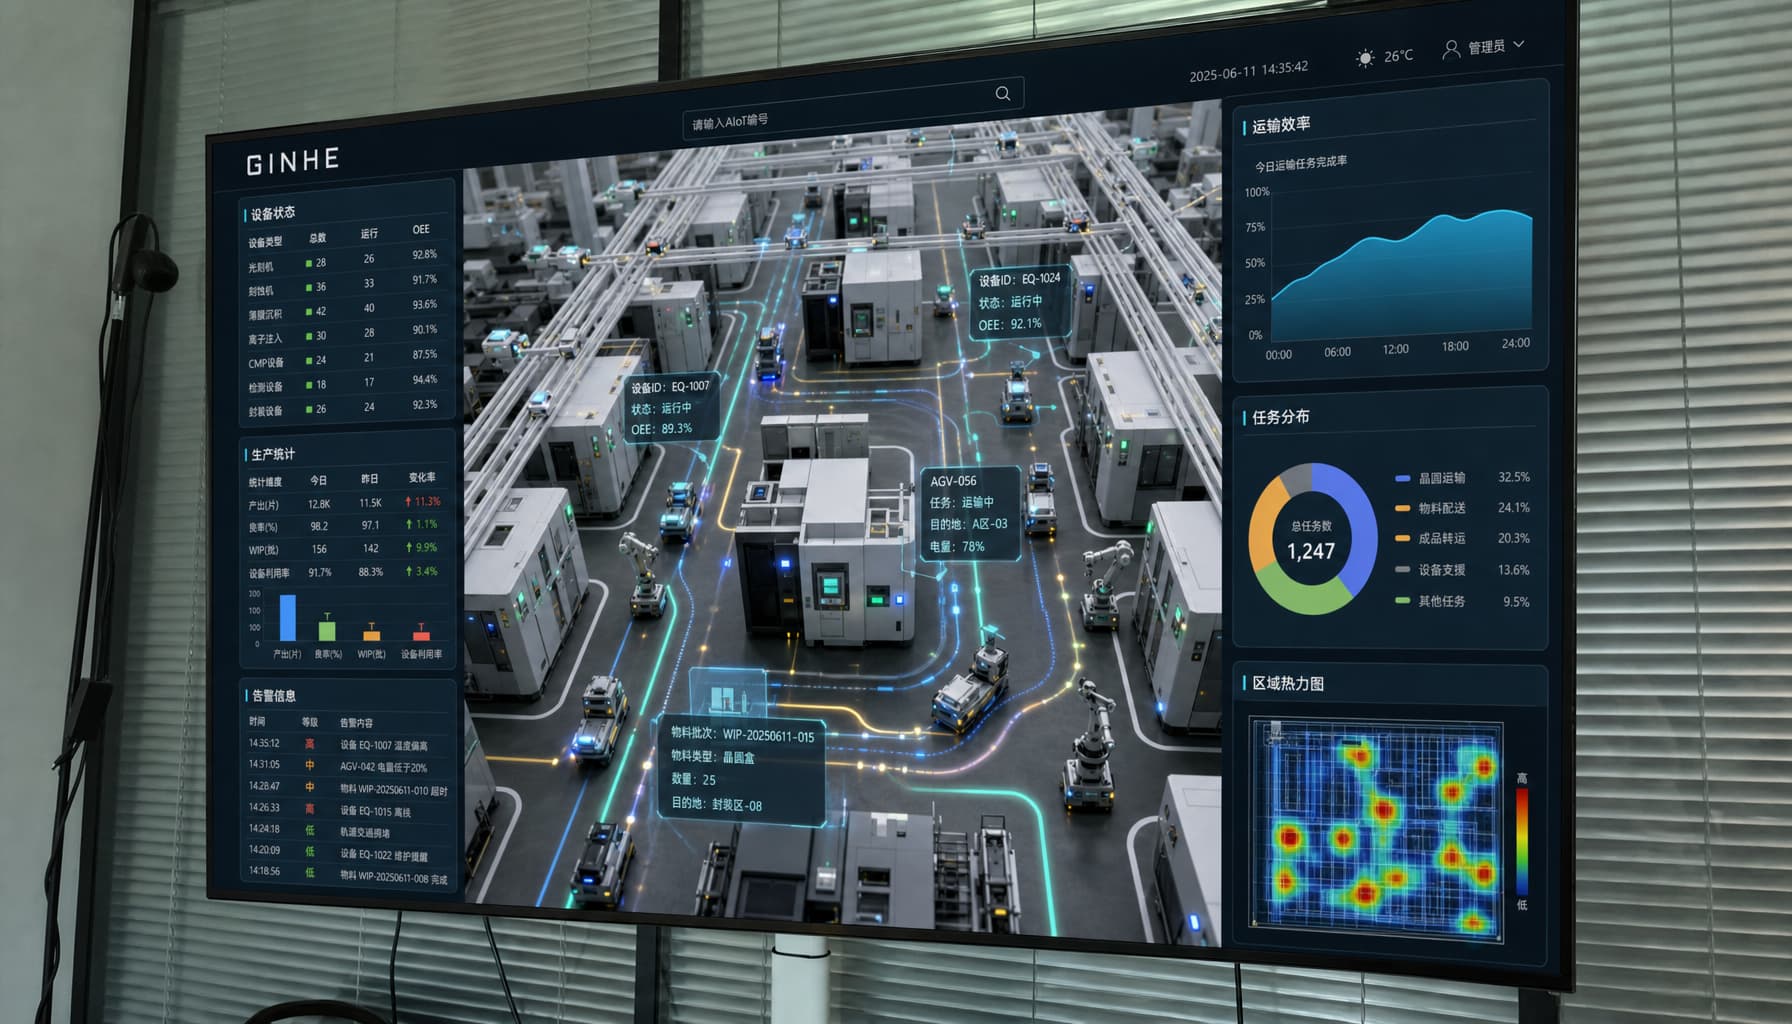
Digital Factory
70%
Commissioning time cut
45%
Rework reduction scale
Virtual plant planning, clash checks, and takt optimization to shorten changeover and commissioning cycles.
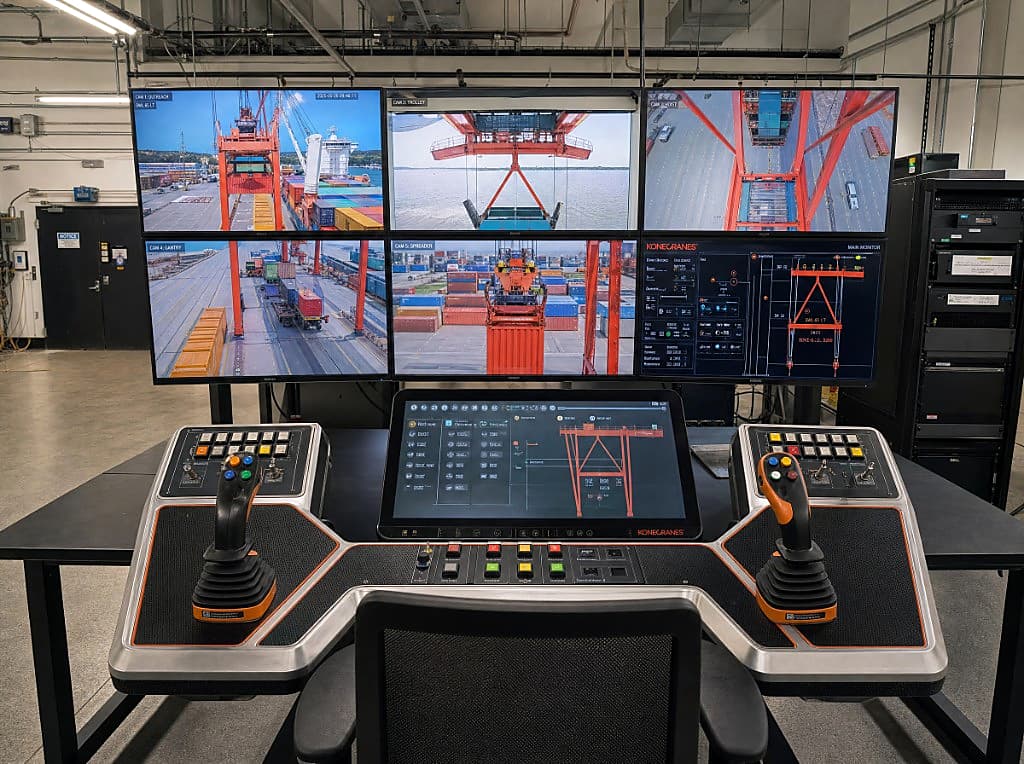
Ports & Shipping
20%
Waiting time saved
15%
Berth utilization up
Port-shipping coordination, tug/pilotage, and yard linkage to cut demurrage and fuel cost.
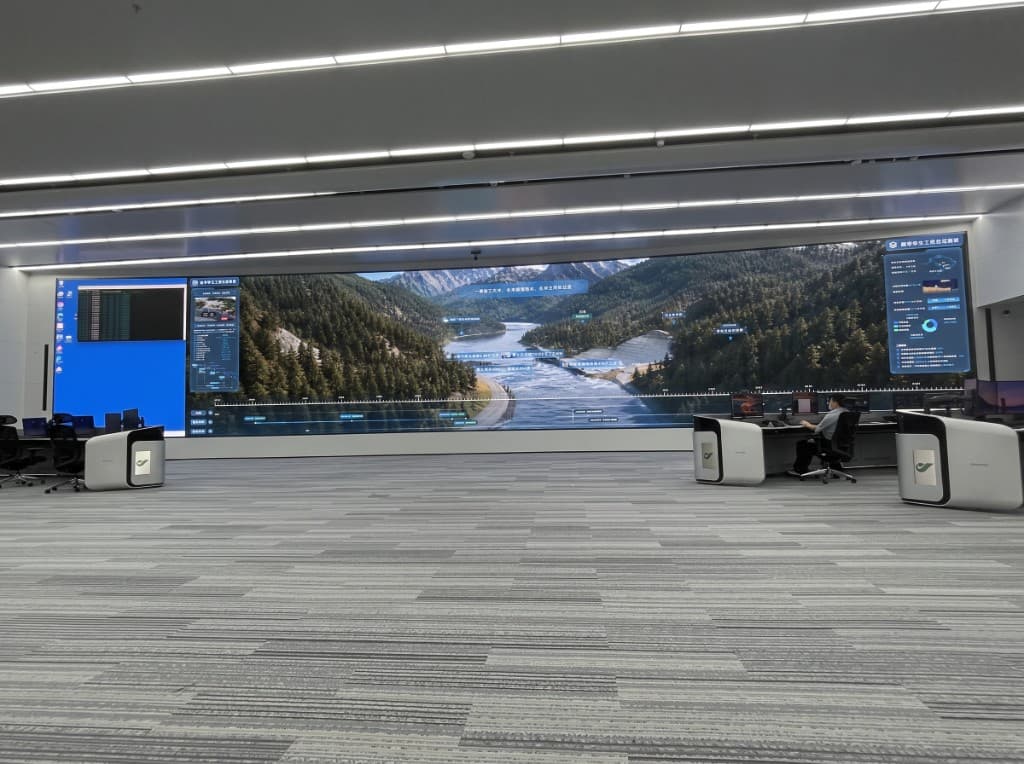
Hydropower
40%
Faster fault handling
60%
Less monitoring load
Holistic sensing, predictive maintenance, and visual decisions for turbines — cutting unplanned downtime and inspection labor.
Delivery Method
Start from one vertical problem — virtual commissioning / training sim / remote O&M / risk drills — prove value fast.
Connect live data and link work-order / training / dispatch systems — not just “see,” but drive action.
Replicate across sites, assets, and processes — from a single project to a long-term platform partnership.